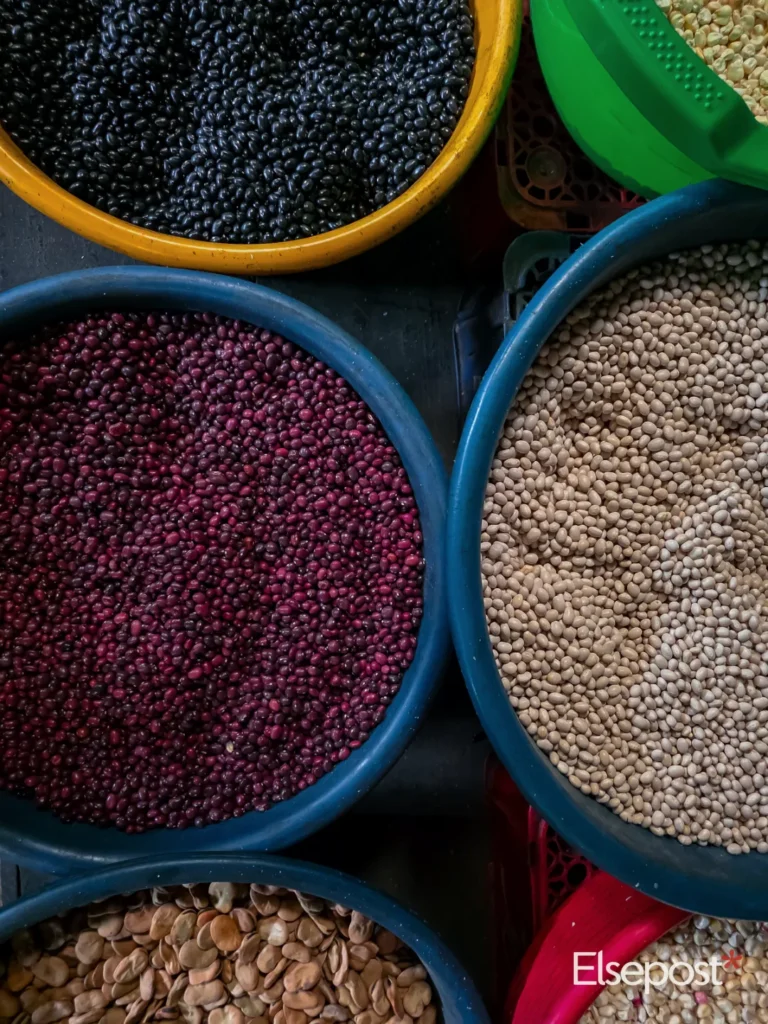
Household food spending India makes up about a third of what families spend, according to a new State Bank of India research report. It draws on the government’s latest household survey. So the numbers offer a useful picture of how Indian kitchens are changing.
Quick answer
- Source: SBI Economic Research Department report, reported on 30 October 2026.
- Data: Household Consumption Expenditure Survey 2023 to 2024, covering 261,953 households.
- Food share: about 32.82% of household consumption spending.
- Non food share: around 67%.
- Theme: more households are paying attention to protein.
What the report found
The National Statistics Office ran the survey between August 2023 and July 2024, across rural and urban India. As SocialNews.XYZ reported, citing IANS, SBI’s team used it to study how food budgets differ by state and income.
The headline is simple. Food takes about 32.82% of spending, and everything else takes around 67%. In other words, the Indian household basket now stretches well beyond essentials.
How food budgets differ across states
On spending for selected protein rich foods, the report says Sikkim and Goa sit at the top, followed by Haryana. Odisha, Chhattisgarh and West Bengal record the lowest averages. However, a lower average does not tell us why. Prices, local diets and income can all play a part.
The report also looks at the variety of protein in a household’s diet. In most states, the data coded for men shows a wider variety than the data coded for women. The gap is largest in Telangana, Odisha, Punjab and Chhattisgarh. It is narrower in Assam, Uttar Pradesh and Gujarat.
Income changes what goes in the basket
The report says budgets for cereals, pulses and milk products vary a lot between income groups. Spending on eggs, fish, meat, vegetables, fruits and dry fruits varies less. Meanwhile, spending on packaged and processed food is becoming more alike across higher spending groups.
The report reads this as a sign that households are prioritising protein and showing more nutritional awareness. That is the authors’ interpretation, so it is best taken as a trend rather than a rule.
What this means for your own kitchen budget
You can use the one third figure as a rough yardstick. If food takes far more than that from your monthly spending, it may be worth tracking where the money goes. Then look at staples you buy in bulk, loose items versus packaged ones, and what gets wasted.
Also, a few small habits help. Check dates on packaged food, which our note on the best before date on sweets explains. If something looks unsafe, you can use the process in our guide to Food Safety Connect.
This is general context, not health or financial advice. For personal dietary needs, a qualified professional is the right person to ask.
FAQ
How much of household spending goes to food in India?
The SBI report puts it at about 32.82% of household consumption spending. Non food goods and services make up around 67%.
Which survey does the report use?
It uses the Household Consumption Expenditure Survey 2023 to 2024 by the National Statistics Office. The survey covered 261,953 households.
Which states spend the most on protein rich foods?
The report names Sikkim and Goa as highest, followed by Haryana. Odisha, Chhattisgarh and West Bengal are the lowest.